Abstract
Currently Azure SQL allows you to configure your database in one of three service tiers, i.e. Basic, Standard and Premium. The service tiers each allow you to select one of several performance levels. In all you have eight possible performance levels; Basic, S0, S1, S2, S3, P1, P2, P3. The goal of this exercise was to provide some quantification of these performance levels.
Setup
Test System: Azure VM with Windows Server 2012 R2 and SQL Server 2014.
Database: SQL database with a complex history table (many columns) which held ~250K records.
Client: SQL Server Mangment Studio (SSMS) hosted on the Test System.
All test runs utilized a copy of the Database. For tests labeled "Local" the Database was hosted on the Test System. For all other tests the Database was hosted as an Azure SQL database under the labeled performance level. All queries were executed from the Client. Reported query execution times are the average of 25 consecutive runs.
Methodology
In the past I've found that a simple, brute force, method of testing database performance is to simply select a few records in a large table sorted by a non-indexed column. The idea is to cause a full-table scan which is obviously a bad thing for performance but exactly the condition I wanted to measure performance levels. In this experiment I tested two separate queries, one meant to provide poor performance and the second well performing. Respectively, the queries used were as follows.
select top 10 * from History order by SomeNonIndexedColumn
select * from History
Results
Analysis
First, note that the Basic and S3 performance levels were not tested. Basic had to be excluded due to the restriction on database size for that performance level. At the time of this test the S3 performance level was in "preview" status so it was also excluded.
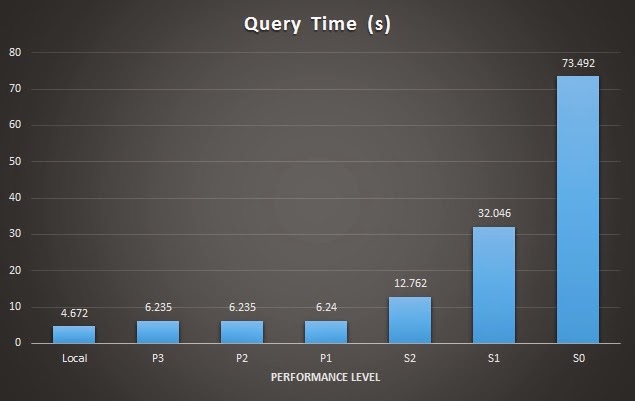
The results of the poor performing query show very clear structure for query performance through all Standard levels and into the first Premium level. After the P1 level structure is less clear and the results for all Premium levels are the same within standard deviation.
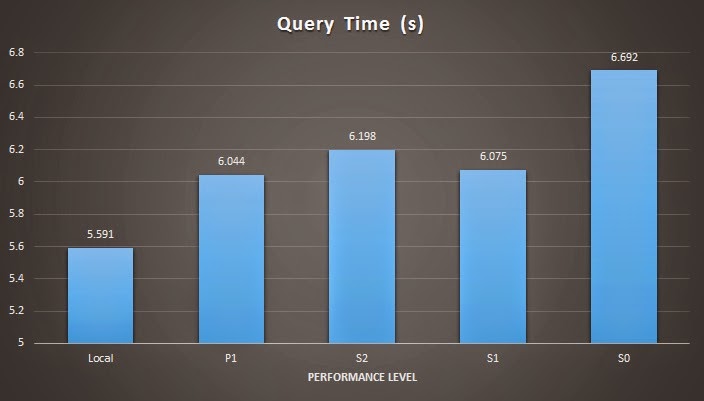
For the well performing query the results for all Azure SQL performance levels were the same within standard deviation an therefore levels P2 and P3 were excluded.
Conclusions
This simple test method succeeded in providing clear structure to the tested performance levels from the S0 through P1 levels. However, it failed to provide meaningful structure between the various Premium levels. The lack of discernible structure between Premium levels should be taken as a limitation of the testing methodology used in this exercise. The method used here was purposefully simplistic and was not expected to fully resolve the differences between all tested levels. There are many factors to consider when selecting an appropriate performance level beyond the execution performance of simple, single connection queries. A discussion of many of these additional factors can be found here